Recitation 3: Methods for Complex Data
Goals: The goals of this lab are to learn how to debug code as well as gain exposure to the image library.
For this lab, there are no starter files. For each problem, start a new project and build the files from scratch.
1 Self-Referential Data
The sliding-tiles game 2048 was all the rage a couple of years ago. The gameplay itself is not that complicated, but since we don’t have all the necessary skills yet, we aren’t going to implement the full game right now. Instead, we’re going to model some of the data behind the gameplay.
Conceptually, a game piece is either a base tile or a merge tile that has two component tiles it merged from. Every game piece can tell you its value, and can merge with another game piece to form a combined tile. Assume all base tiles will have a positive, integer value: for 2048, the default starting value is 2.
;; A GamePiece is one of ;; -- (make-base-tile Number) ;; -- (make-merge-tile GamePiece GamePiece) (define-struct base-tile [value]) (define-struct merge-tile [piece1 piece2])
Convert this data definition into Java classes and interfaces. Make examples of several merged tiles.
With the game-piece classes above, design the following:
Design a method getValue that returns the value of a game piece. The value of a merged tile is always the sum of the values of its components.
Design a method biggestBase that returns the largest base tile value that can be found in the game piece.
- Design a method merge that combines this game piece with the given game piece to form a merged piece. (Ignore the precise validity-checking rules of 2048 for now; suppose that any two tiles can be merged.)
We’ll learn soon how to enforce these rules, and also how to generalize them to variations on 2048’s gameplay.
Design a method isValid that checks whether this game piece was created according to the rules of 2048: only equal-valued pieces can merge.
2 Guided Examples: Using the debugger
This section introduces you to working with the debugger, the equivalent of the stepper in DrRacket. The debugger is more powerful than the stepper, and allows you to pause your program at a particular line, examine the variables available to you, examine the call stack, and many other abilities too. This is necessarily a very brief introduction, and you will learn more about the debugger over time simply by using it and experimenting with it on your own.
Note: using the debugger will not help you fix compile-time errors (like type-mismatches or using a name that doesn’t exist). It can only help you once your program compiles but does not run correctly. IntelliJ will warn you that your code has compile errors before running; you should get in the habit of fixing them, rather than ignoring the warning!
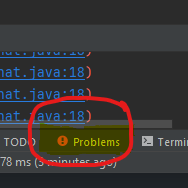
(Confusingly, IntelliJ will still try to run your program...but it will run the latest version that did manage to compile, rather than the current code. This can cause lots of problems with debugging, since the code you’re looking at isn’t the code that’s running.) By paying attention to the problems tab it supplies suggested solutions to your potential syntax errors that may help your new code get through compiling. You can also click the top right interface of your code window, where it will display any potential errors it can debug for you automatically.

You can conversely navigate to the Problems tab and right click on a potential
error indicated by a red error
![]() symbol and click Show Quick-Fixes.
symbol and click Show Quick-Fixes.
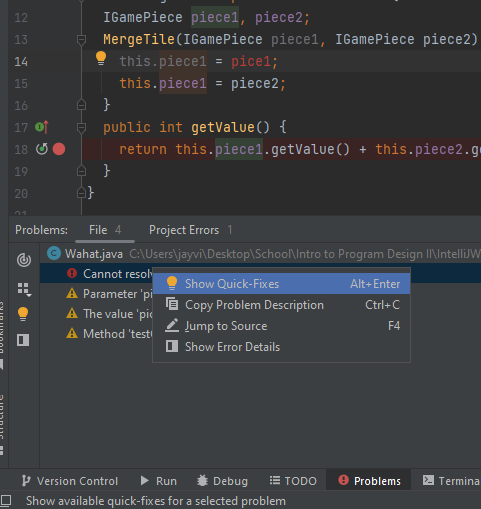
This will provide any suggestions for fixes to simple errors in your code. This section can provide much more which we will get into later.
2.1 Breaking into the debugger
To use the debugger, click the green bug icon in the toolbar instead of the
green circle/triangle Run icon:
![]() Most likely, nothing interesting happens: your program simply runs, just as it
did before. However, let’s suppose that your code has an error, and you’d like
to figure out why.
Most likely, nothing interesting happens: your program simply runs, just as it
did before. However, let’s suppose that your code has an error, and you’d like
to figure out why.
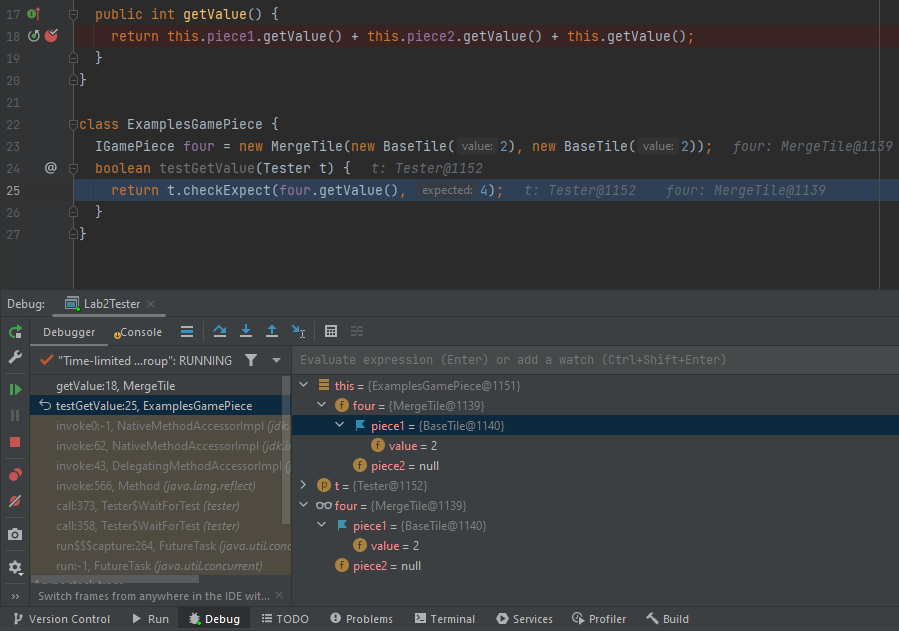
import tester.*; // NOTE: Templates and purpose statements left out: You should fill them in yourself! interface IGamePiece { int getValue(); } class BaseTile implements IGamePiece { int value; BaseTile(int value) { this.value = value; } public int getValue() { return this.value; } } class MergeTile implements IGamePiece { IGamePiece piece1, piece2; MergeTile(IGamePiece piece1, IGamePiece piece2) { this.piece1 = piece1; this.piece1 = piece2; } public int getValue() { return this.piece1.getValue() + this.piece2.getValue() + this.getValue(); } } class ExamplesGamePiece { IGamePiece four = new MergeTile(new BaseTile(2), new BaseTile(2)); boolean testGetValue(Tester t) { return t.checkExpect(four.getValue(), 4); } }
Do Now!
What implementation mistakes do you see in the code above? (Ignore the lack of purpose statements and templates: those are deliberate since we do not intend to give you the answer here!) Write down your predictions first, before running this code.
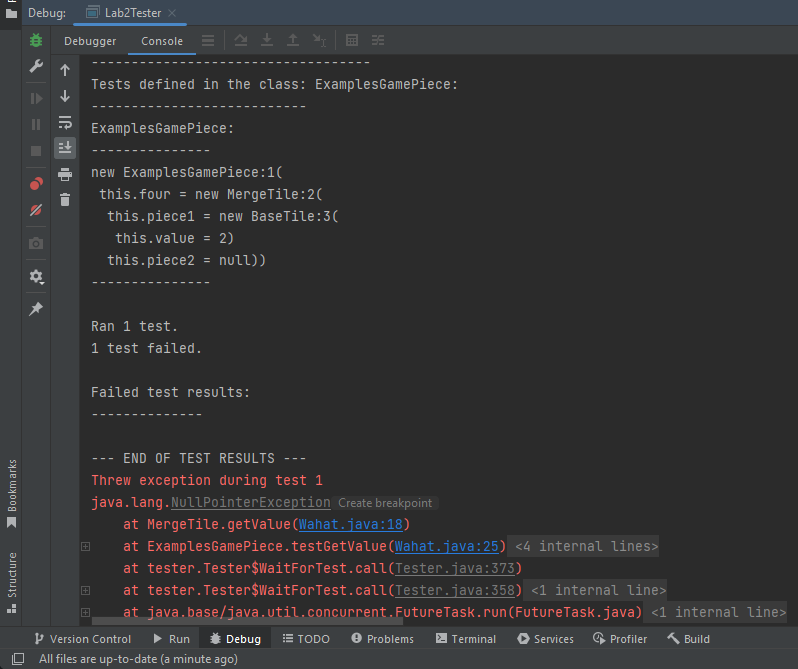 The first two red lines of text tell you merely that a null pointer
exception occurred, and the remaining red lines of text tell you where
it occurred: specifically, in getValue within the MergeTile class
(on line 18), which was called by testGetValue within the
ExamplesGamePiece class (on line 25). This is called the stack
trace, and it gives you context for where your program was at the moment it
broke: the method currently executing is at the top, and its callers are
beneath it. (Everything after that red line is also part of the stack trace.
You can ignore anything below your own examples class, though, since those
other lines refer to internal methods that, ultimately, were invoked by
the tester library itself to get your program started.) The file-and-line
information (orange in this screenshot; possibly blue on your system, depending
on which operating system you’re using) is clickable, and will jump your cursor
to the appropriate line and select it.
The first two red lines of text tell you merely that a null pointer
exception occurred, and the remaining red lines of text tell you where
it occurred: specifically, in getValue within the MergeTile class
(on line 18), which was called by testGetValue within the
ExamplesGamePiece class (on line 25). This is called the stack
trace, and it gives you context for where your program was at the moment it
broke: the method currently executing is at the top, and its callers are
beneath it. (Everything after that red line is also part of the stack trace.
You can ignore anything below your own examples class, though, since those
other lines refer to internal methods that, ultimately, were invoked by
the tester library itself to get your program started.) The file-and-line
information (orange in this screenshot; possibly blue on your system, depending
on which operating system you’re using) is clickable, and will jump your cursor
to the appropriate line and select it.
Do Now!
Try clicking on these links, yourself. What happens when you click on a link that doesn’t belong to your own code?
The NullPointerException is clickable too, but it controls something else: a different kind of breakpoint besides the ones we’ll discuss below. If you’re curious, try coming back to this after you’ve tried the other fixes below, and try enabling this breakpoint. You’ll want to explore the Breakpoints tab, too, once you’ve done this, in order to delete this breakpoint once you’re done with it!
Do Now!
What line of code do you think might be useful to pause on? Why?
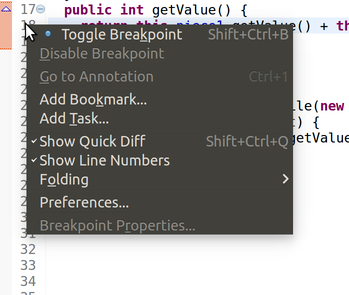
This means you have selected a Breakpoint. Visually, this will add a little red circle in the margin to the left of the line number. That signifies a Breakpoint, which will cause your program to pause whenever you execute your program in debugging mode, and execution reaches that line. You can repeat this process to remove the breakpoint again, when you’re done debugging the problem.
Most important: At the upper-right in the toolbar, you should see Run and Debug. (You might not see the words, just the icons.)

You can click Run to get back to your original window layout and the run tab.
While in the bottom Debug tab of IntelliJ, the Debugger tab inside shows you the current call stack. You can click on lines of the call stack to jump to the relevant line of code. (Right now, line 18 is focused.)
In the middle is your code, and the outline of your program.
At the bottom, the Console tab shows the current output of your program.
In the right pane, in the Variables tab shows you the variables that are currently in scope. Right now, the only variable available is this when you run your debugger with a breakpoint on line 18.
Next to it is the Breakpoints tab, which shows all the current breakpoints you have enabled. We don’t need this much right now.
In the upper-left corner in the Debug toolbar, you’ll see several icons related to stepping:


From left to right, these are: Resume the program, Pause the current program, Stop debugging, Step over the next method call, Step into the next method call, and Step out of the current method.
2.2 Stepping into, viewing Variables, thinking about the stack
Do Now!
Double-click on this in the Variables tab, or click on the expansion arrow to its left, to see the fields that it has. Also try hovering over this, this.piece1 and this.piece2 in the code area. What do you see?
Do Now!
Can you figure out the first bug in the code above?
Do Now!
List all the changes that just happened.
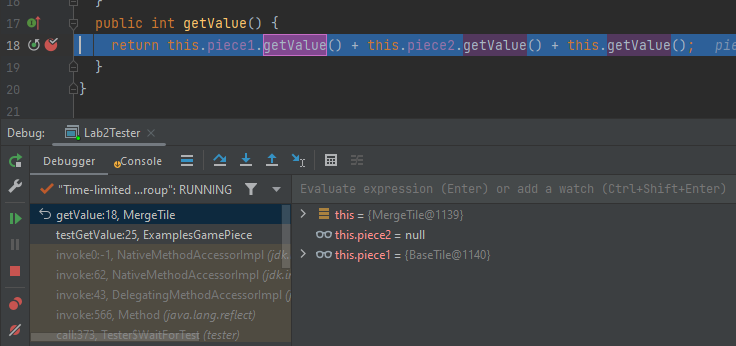
You should all the methods .getValue() get highlighted violet while the breakpoint line is highlighted. Click on the first .getValue() method.
You should see: the stack trace in the Debug tab has added a new line for the current getValue call; the highlighted line of code has changed to line 9 (in BaseTile); the Variables tab has changed to show that this is currently a BaseTile; the Outline tab has highlighted the BaseTile class.
Hover over this and this.value in the code area. Click the dropdown menu in this. You should see that the values look fine. Press any of the stepper buttons once to continue. (In this setting, all three stepper buttons do the same thing, since we are at the point of returning from a method, so there is nothing to step into or over. Don’t use the Resume button here; that will run your program until it encounters the next breakpoint, and there might not be any more breakpoints.) The active line moves back to line 18. Evidently, the call to this.piece1.getValue() has succeeded. Press Step into again, to try the next call to this.piece2.getValue(). Suddenly everything breaks, and you’re taken to the constructor for a NullPointerException. Suspicion confirmed: the fact that piece2 is null is the problem.
Do Now!
Will this help? Why or why not?
Do Now!
Debug the program. When you get to line 14, double-click the this in the Variables tab. Press Step into once, and observe the changes in the Variables tab. What line gets highlighted yellow? Press Step into once more. What happens?
Since piece2 remains null, evidently our mistake must be here. Carefully reading the code reveals the typo: we initialized piece1 twice by mistake.
Do Now!
Press Stop to stop the program. Fix the code, and debug it again. This time, when you get to line 14, press the Resume button to keep running after the breakpoint. What happens now?
2.3 Stepping over, stepping out
We have another problem: the tester library reports stack overflowed while running test. This means that we have an unbounded recursion somewhere in our program. Looking at the stack trace (be sure to scroll to the very top) is quite boring: it consists of hundreds of red lines all blaming line 18 of our program.
Do Now!
Clear all the breakpoints you currently have, and put a breakpoint on line 18 again. Debug the program.
When you get to line 18, start stepping through the program again. Using Step into is tedious, since it will take us into the BaseTile implementations. Using the other two stepper buttons doesn’t seem to work. This is because we have three method calls all on one line, and IntelliJ is quite simplistic when it comes breakpoints and to your program’s layout. Add newlines before the plus signs on line 18, to split the three method calls onto three separate lines. Now, you can successfully use Step over to run the entirety of this.piece1.getValue() as a single step, and similarly for this.piece2.getValue(). Now use Step into to step into the call to this.getValue(). The stack trace in the Debug tab has grown, and nothing else has changed. Keep doing this a few times, until you recognize the problem: we are recurring into the exact same method on the exact same object – of course we’re stuck in an infinite recursion! This implementation does not properly follow the template: fix it, by eliminating the call to this.getValue() altogether, since it’s unneeded.
Stop and then debug the program one more time, to confirm that it works properly. Finally, click on Java in the upper-right toolbar to get back to the normal code-editing window layout.
3 Using the javalib library
The javalib library provides the support for the design of interactive games and creating images composed by combining geometric shapes as well as image files.
To use the library, download the javalib.jar file above and add it to your project the same way you have added the tester library
At the top of the .java file where the library is used, add the following import statements:
import tester.*; // The tester library import javalib.worldimages.*; // images, like RectangleImage or OverlayImages import javalib.funworld.*; // the abstract World class and the big-bang library import javalib.worldcanvas.*; // so we can view our images import java.awt.Color; // general colors (as triples of red,green,blue values) // and predefined colors (Red, Green, Yellow, Blue, Black, White)
The first one is familiar; the rest are needed to import and use the definitions from javalib.
Much like the image library for ISL, our image library for Java also comes with extensive documentation.
3.1 Basic Images
Note: The purpose of this section of the lab is to get you exposed to our image library. Be sure to actually run the examples given so you get a feel for it before you have to use it on homework!
Here is a snippet of code that will let us draw and look at a circle:
class ExamplesShapes { WorldImage circle = new CircleImage(100, OutlineMode.SOLID, Color.BLUE); WorldCanvas c = new WorldCanvas(500, 500); WorldScene s = new WorldScene(500, 500); boolean testDrawMyShapes(Tester t) { return c.drawScene(s.placeImageXY(circle, 250, 250)) && c.show(); } }
And here is a snippet of code that will let us draw and look at two circles:
class ExamplesShapes { WorldImage circle = new CircleImage(100, OutlineMode.SOLID, Color.BLUE); WorldCanvas c = new WorldCanvas(500, 500); WorldScene s = new WorldScene(500, 500); boolean testDrawMyShapes(Tester t) { return c.drawScene(s.placeImageXY(circle, 250, 250)) && c.drawScene(s.placeImageXY(circle, 100, 300)) && c.show(); } }
However, it would be nice to be able to look at separate images separately, and to be able to identify which image is which. It would also be nice to not have to construct new canvases and scenes over and over again by hand. Here is a snippet of code that you can use to look at multiple images and tell them apart with much less work needing to be done for each image.
class ExamplesShapes { // shows image at the center of an equally-sized canvas, // and the text at the top of the frame is given by description boolean showImage(WorldImage image, String description) { int width = (int) Math.ceil(image.getWidth()); int height = (int) Math.ceil(image.getHeight()); WorldCanvas canvas = new WorldCanvas(width, height, description); WorldScene scene = new WorldScene(width, height); return canvas.drawScene(scene.placeImageXY(image, width / 2, height / 2)) && canvas.show(); } WorldImage circleBlue = new CircleImage(100, OutlineMode.SOLID, Color.BLUE); WorldImage circleRed = new CircleImage(100, OutlineMode.SOLID, Color.RED); boolean testDrawMyShapes(Tester t) { return showImage(circleBlue, "Blue circle") && showImage(circleRed, "Red circle"); } }
Being able to look at your images will be helpful for debugging in future assignments as well as this lab. Note that this is not a replacement for proper tests, and that methods that output images can be tested in the tester library just like any other method.
Draw at least two other basic shapes, such as a square and a triangle
Give your lab partner a friendly message by drawing some text
Draw the empty image
3.2 Combining Images
Draw two images beisde each other
Overlay one image on top of another
3.3 Pinholes
Draw a visible pinhole image
Draw a visible pinhole of an image whose pinhole you have moved
Shift pinholes as needed to overlay a red circle in the upper right corner of a green rectangle whose lower left corner is overlayed on top of a blue triangle
Use a line image to connect two distantly placed shapes
3.4 Drawing Tiles
Design a method that draws a game piece from the first section of the lab. All tiles should be displayed as a square with its value drawn in the center, and tiles with subtiles should have those drawn beneath it on its left and right. Keep improving your drawing method until the resulting tree is well drawn and aesthetically pleasing.